Tote Bag : Global warming


![]()
Home Decor from Science Photo Library
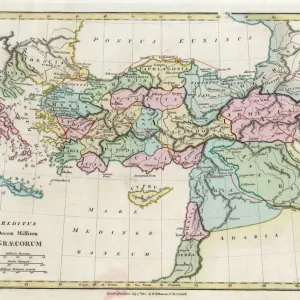
Global warming
Global warming. Composite image of a graph of average global sea surface temperature (SST) change and the Earth. The graph shows the change in average temperature in C centrigrade between the years 1856 and 2000
Science Photo Library features Science and Medical images including photos and illustrations
Media ID 6350059
© VICTOR DE SCHWANBERG/SCIENCE PHOTO LIBRARY
Analysing Analysis Annual Average Axis Chart Climate Change Composite Data Date Dated Dates Earth Science Environmental From Space Global Warming Globe Graph Heat Image Numbered Numbers Photos Record Recording Rise Rising Round Satellite Satellite Image Sciences Sphere Spherical Temperature Warming Up Year Years Charting Concepts Recorded
Canvas Tote Bag
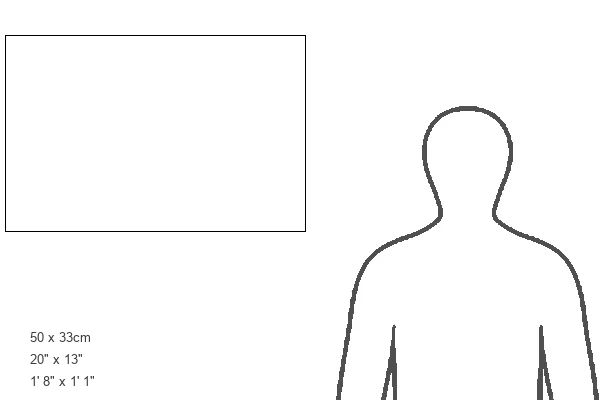
Our tote bags are made from soft, durable, poly-poplin fabric and include a one inch (2.5cm) black strap for easy carrying on your shoulder. All seams are double-stitched for added durability. Each tote bag is machine-washable in cold water and is printed on both sides using the same image. Approximate size of bag is 50x33cm (20"x13")
Our tote bags are made from soft durable fabric and include a strap for easy carrying
Estimated Product Size is 50cm x 32.7cm (19.7" x 12.9")
These are individually made so all sizes are approximate
MADE IN THE UK
Safe Shipping with 30 Day Money Back Guarantee
FREE PERSONALISATION*
We are proud to offer a range of customisation features including Personalised Captions, Color Filters and Picture Zoom Tools
SECURE PAYMENTS
We happily accept a wide range of payment options so you can pay for the things you need in the way that is most convenient for you
* Options may vary by product and licensing agreement. Zoomed Pictures can be adjusted in the Basket.