Framed Print > Animals > Insects > Hemiptera > Yellow Scale
Framed Print : Diagram showing the spectral class and luminosity of stars


![]()
Framed Photos from Stocktrek
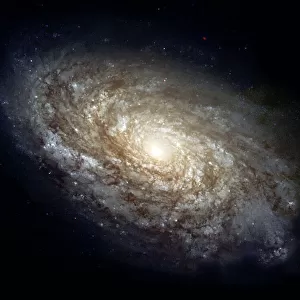
Diagram showing the spectral class and luminosity of stars
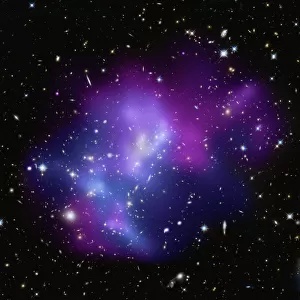
Diagram showing the spectral class and luminosity of stars. The diagram was named The Hertzsprung-Russell Diagram, or the H-R diagram for short. At the beginning of the 20th century two astronomers found that if stars were plotted on a diagram with their luminosity (brightness) on one axis, and their spectral class on the other, that stars formed three distinct groups. The largest group, the Main Sequence Stars, is where 90% of the stars are found. These stars are fusing hydrogen into helium in their cores. This group propagates diagonally from the upper left corner, down to the right corner. The group below the main sequence is the White Dwarfs, which is a group of small, earth-sized stellar remnants. The third group, which is found above the main sequence is that of the giants.
Stars appear on a specific place on the main sequence depending on their mass and age. The mass determines when it will leave the main sequence.The H-R diagram is a significant tool for astronomers, when it comes to understanding stellar evolution
Stocktrek Images specializes in Astronomy, Dinosaurs, Medical, Military Forces, Ocean Life, & Sci-Fi
Media ID 13058701
© Fahad Sulehria/Stocktrek Images
Astrophysics Blue Chart Comparison Diagram Dwarf Stars Giant Stars Green Hydrogen Hypergiant Luminosity Main Sequence Stars Pattern Phase Remnants Representation Scale Sequence Size Spectrum Stellar Supergiants Temperature Text Variation White Dwarfs Yellow Axis Brightness Classification Evolution Fusion Graph Helium Magnitude Nuclear Fusion Plot Scatter Variable
14"x12" (38x32cm) Modern Frame
Introducing the Media Storehouse Framed Print of "The Hertzsprung-Russell Diagram" by Fahad Sulehria from Stocktrek Images. This captivating scientific diagram showcases the relationship between a star's spectral class and luminosity, providing a visual representation of stellar evolution. The H-R diagram, as it's commonly known, is an essential tool in astronomy, helping us understand the life cycles of stars. Bring this beautiful and informative piece into your home or office to inspire curiosity and ignite conversations about the wonders of the universe. Our high-quality framed prints are meticulously crafted to preserve the vibrant colors and intricate details of the original image, ensuring a stunning display that will last for years to come.
Wood effect frame, card mounted, 10x8 archival quality photo print. Overall outside dimensions 14x12 inches (38x32cm). Environmentally and ozone friendly, 40mm wide x 15mm Polycore® moulding has the look of real wood, is durable and light and easy to hang. Biodegradable and made with non-chlorinated gases (no toxic fumes) it is efficient; producing 100 tons of polystyrene can save 300 tons of trees! Prints are glazed with lightweight, shatterproof, optical clarity acrylic (providing the same general protection from the environment as glass). The back is stapled hardboard with a sawtooth hanger attached. Note: To minimise original artwork cropping, for optimum layout, and to ensure print is secure, the visible print may be marginally smaller
Contemporary Framed and Mounted Prints - Professionally Made and Ready to Hang
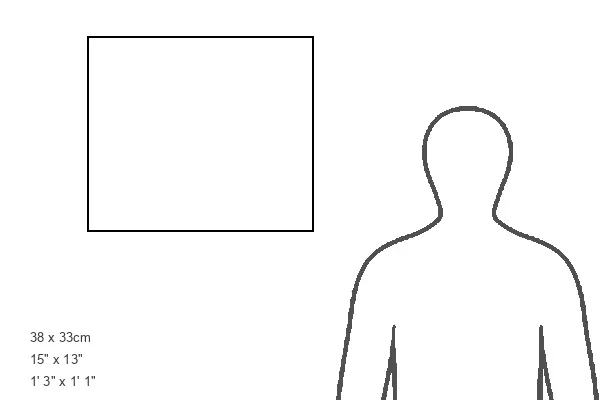
Estimated Image Size (if not cropped) is 24.4cm x 17.1cm (9.6" x 6.7")
Estimated Product Size is 37.6cm x 32.5cm (14.8" x 12.8")
These are individually made so all sizes are approximate
Artwork printed orientated as per the preview above, with landscape (horizontal) orientation to match the source image.
FEATURES IN THESE COLLECTIONS
> Animals
> Fishes
> R
> Red Grouper
> Animals
> Insects
> Hemiptera
> Green Scale
> Animals
> Insects
> Hemiptera
> Yellow Scale
> Maps and Charts
> Related Images
EDITORS COMMENTS
This print showcases a remarkable diagram known as The Hertzsprung-Russell Diagram, or the H-R diagram for short. Created at the beginning of the 20th century by two visionary astronomers, this diagram revolutionized our understanding of stars. By plotting stars based on their luminosity and spectral class, three distinct groups emerged. The largest group, occupying a prominent position along a diagonal line from the upper left to the lower right corner, is called Main Sequence Stars. These magnificent celestial bodies make up an astounding 90% of all stars and are engaged in fusing hydrogen into helium within their cores. Beneath the main sequence lies another group known as White Dwarfs. These small remnants resemble Earth in size but possess extraordinary cosmic significance. Above the main sequence resides yet another awe-inspiring group: giants. These colossal stellar beings captivate us with their immense size and radiance. Stars find their place on the main sequence depending on both mass and age, with mass determining when they will eventually depart from this stage of stellar evolution. The H-R diagram stands as an invaluable tool for astronomers seeking to unravel the mysteries of our universe's past and future. Its profound insights into stellar evolution have propelled humanity's understanding of these celestial wonders to new heights.
MADE IN THE UK
Safe Shipping with 30 Day Money Back Guarantee
FREE PERSONALISATION*
We are proud to offer a range of customisation features including Personalised Captions, Color Filters and Picture Zoom Tools
SECURE PAYMENTS
We happily accept a wide range of payment options so you can pay for the things you need in the way that is most convenient for you
* Options may vary by product and licensing agreement. Zoomed Pictures can be adjusted in the Basket.