
Radiometer Collection
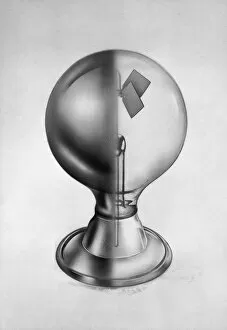
The radiometer, invented by Sir William Crookes in 1873, has come a long way since its inception


All Professionally Made to Order for Quick Shipping
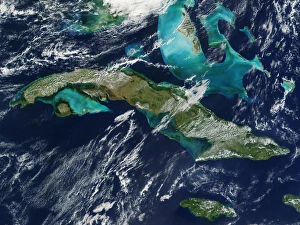
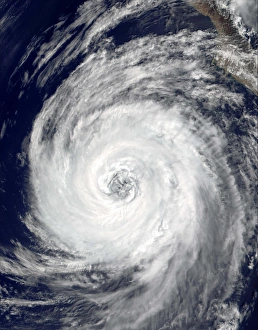
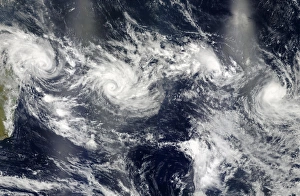
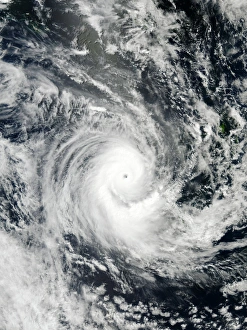
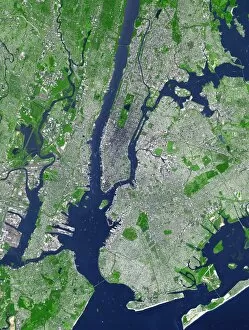
The radiometer, invented by Sir William Crookes in 1873, has come a long way since its inception. This fascinating device has played an integral role in various scientific endeavors across the globe. In Cuba, the radiometer proved invaluable during the aftermath of the Merapi volcanic eruption in June 2006. Its ability to measure and analyze atmospheric conditions helped scientists understand the impact of this natural disaster on air quality and climate patterns. With its mid-20th-century illustration, the radiometer symbolizes a time when technological advancements were rapidly transforming our understanding of the world. It became an essential tool for mapping Earth's surface as seen from space, contributing to creating comprehensive images like the Whole Earth map. Antarctica's polar sea ice was meticulously studied using satellite MODIS observations combined with NASA and Japan's Ministry of Economy, Trade and Industry's Advanced Spaceborne Radiometer data. These collaborative efforts shed light on crucial information about our planet's changing climate and ecosystems. Another remarkable application of this instrument is evident in capturing sea surface salinity worldwide through global maps such as C016/3796 from 2012. Such data helps monitor ocean currents, study marine life habitats, and predict weather patterns more accurately. Tropical Storm Lane serves as a reminder that they are instrumental in tracking tropical cyclones' movements. By analyzing these storms' characteristics using advanced technology like radiometers, meteorologists can provide timely warnings to vulnerable coastal regions. Not limited to atmospheric phenomena alone, radiometers have also been used to observe sandstorms over places like Canary Islands. These measurements aid researchers in comprehending how these powerful events occur and their potential impacts on local environments. Lastly, even iconic landmarks like River Nile have been subject to scrutiny using this versatile device. Radiometers help monitor water levels along rivers globally – vital information for managing resources efficiently while mitigating flood risks downstream. From volcanic eruptions to tropical storms and beyond - it is clear that radiometers have revolutionized our understanding of Earth's complex systems.