Fraud Blocker Skip to main content

Chart Collection (page 93)

"Unlocking the Secrets: Exploring the Fascinating World of Charts" Dive into the realm of reflexology with a detailed foot map chart

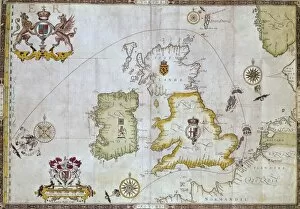
Background imageChart Collection: Portolan chart, 1587. Map of England, Scotland

Portolan chart, 1587. Map of England, Scotland and Ireland with the north France coast. Realized in Messina. Facsimile. Renaissance art. Miniature Painting

Background imageChart Collection: Map of the Mediterranean (Add. Ms. 25691). It

Map of the Mediterranean (Add. Ms. 25691). It
Map of the Mediterranean (Add.Ms. 25691). It is probably the oldest portolan chart from the school of Mallorca ca. 1327-1330. Are represented Italy, Sicily and North Africa. Miniature Painting

Background imageChart Collection: Lopo Homem (16th c. ); REINEL, Jorge (1502 - 1572)

Lopo Homem (16th c. ); REINEL, Jorge (1502 - 1572)
Lopo Homem (16th c.); REINEL, Jorge (1502 - 1572); REINEL, Pedro (ca. 1462 - 1542). Atlas Miller. 1519. Portolan chart, 1587. Map of Western Europe and North Africa. Printed in Messina. Facsimile

Background imageChart Collection: Spain. Peninsular War (1808-1814). Letter of

Spain. Peninsular War (1808-1814). Letter of Napolon to his brother Jos頉, king of Espa񡮠 SPAIN. Madrid. Army Museum

Background imageChart Collection: Christopher Columbus First Voyage to America

Christopher Columbus First Voyage to America
" Christopher Columbus First Voyage to America (1492). Discover of the islands of Concepci󮬠 Fernandina, Isabela, Salvador

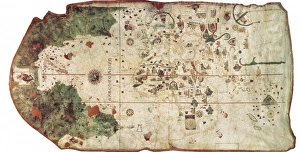
Background imageChart Collection: COSA, Juan de la (1460-1510). Cartographer. Nautical

COSA, Juan de la (1460-1510). Cartographer. Nautical chart. 1500. Detail. SPAIN. Madrid. Navy Museum

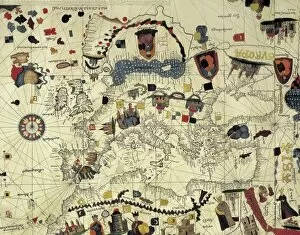
Background imageChart Collection: Portolan chart, 16th c. Map of the Eastern Mediterranean

Portolan chart, 16th c. Map of the Eastern Mediterranean Sea and the Black sea. (Anonymous, it is believed to be made by Joan Martines or by his workshop). Renaissance art. Miniature Painting. SPAIN

Background imageChart Collection: Chart by Juan de la Cosa (1500). SPAIN. Madrid

Chart by Juan de la Cosa (1500). SPAIN. Madrid. Navy Museum

Background imageChart Collection: Portolan chart, 1587. Map of South America. Made

Portolan chart, 1587. Map of South America. Made in Messina. Renaissance art. Miniature Painting. SPAIN. Madrid. National Library

Background imageChart Collection: Portolan chart atlas, 1591. World map. Renaissance

Portolan chart atlas, 1591. World map. Renaissance

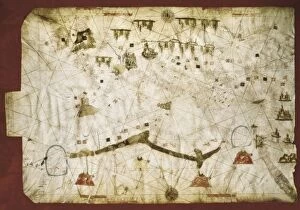
Background imageChart Collection: Venetian portolan chart. Anonymous, 14th c

Venetian portolan chart. Anonymous, 14th c. It includes the Atlantic coast to the Middle East, and from the African coast of the Mediterranean to England and Ireland

Background imageChart Collection: Scene of Mahabharata (18th c. ). Arjuna on a chart

Scene of Mahabharata (18th c. ). Arjuna on a chart
Scene of Mahabharata (18th c.). Arjuna on a chart led by Krishna. Hindu art. Miniature Painting. FRANCE. Paris. National Library

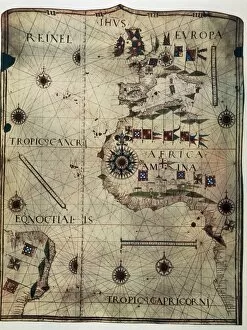
Background imageChart Collection: Nautical chart depicting the West Coast of Africa

Nautical chart depicting the West Coast of Africa, Brazil, the North Atlantic Ocean and the South Atlantic Ocean, by Jorge Reinel. 1535

Background imageChart Collection: Chart illustrating the pollution of water supplies through low-level nuclear waste, c1970

Chart illustrating the pollution of water supplies through low-level nuclear waste, c1970
WATER POLLUTION. Chart illustrating the pollution of water supplies through low-level nuclear waste, c1970

Background imageChart Collection: BILL OF RIGHTS, 1791. Thomas Jeffersons tally of the states votes to ratify ten of twelve amendments

BILL OF RIGHTS, 1791. Thomas Jeffersons tally of the states votes to ratify ten of twelve amendments (the Bill of Rights), introduced in Congress in 1789

Background imageChart Collection: Plan of Fire Guard Organisation, WW2

Plan of Fire Guard Organisation, WW2
Plan of the Fire Guard Organisation

Background imageChart Collection: ANTARCTICA: OZONE, 1988. A graphic showing the variations in ozone over the Antarctic between 1984

ANTARCTICA: OZONE, 1988. A graphic showing the variations in ozone over the Antarctic between 1984 and 1988

Background imageChart Collection: KARL GUTHE JANSKY (1905-1950). American physicist and radio engineer. Pointing to a chart, 1933

KARL GUTHE JANSKY (1905-1950). American physicist and radio engineer. Pointing to a chart, 1933, indicating the area of the Milky Way galaxy where he first detected radio noises from space

Background imageChart Collection: GULF STREAM: MAP, 1786. Chart of the Gulf Stream published by Benjamin Franklin, 1786

GULF STREAM: MAP, 1786. Chart of the Gulf Stream published by Benjamin Franklin, 1786

Background imageChart Collection: SPANISH ARMADA, 1588. The Spanish and English fleets en route to Calais, France

SPANISH ARMADA, 1588. The Spanish and English fleets en route to Calais, France, during the attempted Spanish invasion of England, 1588. Engraving by Augustine Ryther, after Roberto Adamo

Background imageChart Collection: SPANISH ARMADA, 1588. Map showing different positions of the Spanish Armada

SPANISH ARMADA, 1588. Map showing different positions of the Spanish Armada and the English Royal Navy, 1588. Engraving by Augustine Ryther, from Expeditionis Hispanorum, 1590

Background imageChart Collection: Chronological chart of American history--Dedicated to the pe

Chronological chart of American history--Dedicated to the people of the United States by the publisher. Tree inscribed with historical events and vignettes of three Native Americans on bank

Background imageChart Collection: Chart of odd fellowship

Chart of odd fellowship. Date c1895 Feb. 8

Background imageChart Collection: Business wagon chart, 1881

Business wagon chart, 1881. Date c1881 Aug. 24

Background imageChart Collection: Chart of illustrations for business purposes

Chart of illustrations for business purposes. Date c1855

Background imageChart Collection: Chart no. 5

Chart no. 5

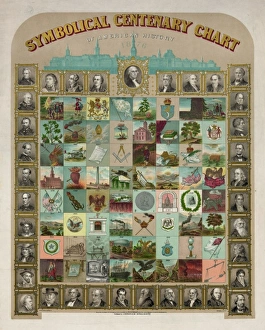
Background imageChart Collection: Symbolical centenary chart of American history 1876

Symbolical centenary chart of American history 1876. Date c1874

Background imageChart Collection: Masters chart. Entered apprentice

Masters chart. Entered apprentice

Background imageChart Collection: Light of ages. Chart of revealed truth
Light of ages. Chart of revealed truth. Date c1894 May 18

Background imageChart Collection: Templars chart

Templars chart

Background imageChart Collection: Memorial chart centennial jubilee

Memorial chart centennial jubilee

Background imageChart Collection: A family chart for the United States

A family chart for the United States. Date c1835 Apr. 17

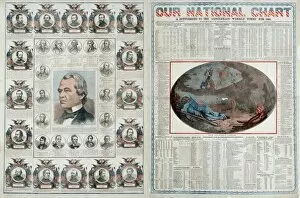
Background imageChart Collection: Our national chart, a supplement to the Cincinnati Weekly Ti

Our national chart, a supplement to the Cincinnati Weekly Times for 1866. Print showing right side illustration of The soldiers dream in which a soldier asleep on the ground during the Civil War

Background imageChart Collection: National republican chart

National republican chart

Background imageChart Collection: Analysis of the weather of 1911

Analysis of the weather of 1911
A chart analysing the extraordinarily hot weather experienced during the summer of 1911, which saw 660 hours of sunshine in three months. Date: 1911

Background imageChart Collection: Russian children learning the alphabet

Russian children learning the alphabet
Three Russian boys learning the alphabet Date: circa 1910s

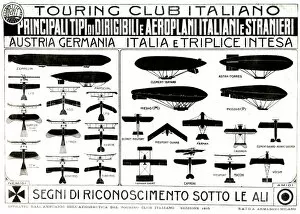
Background imageChart Collection: Touring Club Italiano chart, aeroplanes and airships

Touring Club Italiano chart, aeroplanes and airships
Touring Club Italiano chart of aeroplanes and airships, Italian and foreign (German, Austrian, French, British), for recognition purposes

Background imageChart Collection: Poster advertising wartime savings -- Salute the Soldier

Poster advertising wartime savings -- Salute the Soldier -- to help support the war effort. The soldier is given a movable arm to indicate the total raised to date. 1940s

Background imageChart Collection: 19th century map of the Moon

19th century map of the Moon
Map of the Moon, 1892. This lunar map shows the colouring of the surface and position of the craters

Background imageChart Collection: Interferometer readings

Interferometer readings. This graph shows the results of a test carried out on the isotopes Kr-86 (Krypton 86) and Hg-198 (Mercury 198) by a Fabry-Perot interferometer

Background imageChart Collection: Photograph of the Moon, 1885

Photograph of the Moon, 1885
Early photographs of the Moon. Published in 1885, these photographs were taken by Dr Henry Draper (1837-1882), an American astronomer

Background imageChart Collection: Caesium atomic clock readings

Caesium atomic clock readings. A caesium atomic clock contains atoms of vapourised caesium-133 that pass back and forth between magnets at each end of the clock

Background imageChart Collection: Tychos great brass globe

Tychos great brass globe. Tycho Brahe (1546-1601) was a Danish astronomer. This celestial globe was one of the instruments at Tychos observatory at Uraniborg, on the island of Hven

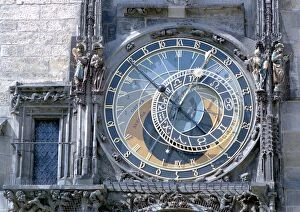
Background imageChart Collection: Astronomical Clock, Prague

Astronomical Clock, Prague, Czech Republic. This astronomical dial dates back to 1410 and displays three different sets of time; central European time, old Bohemian time and Babylonian time

Background imageChart Collection: Virtual office

Virtual office
MODEL RELEASED. Virtual office. Conceptual computer artwork of a globe and office laptop computers displaying human faces, representing a virtual office

Background imageChart Collection: Financial paperwork

Financial paperwork. Graph showing the rising Net Asset Value (NAV) of an investment company. The NAV illustrates the amount one shareholder would receive for each share owned if the company sold all

Background imageChart Collection: Early map of the Moon, 1772

Early map of the Moon, 1772
Map of the Moon, by De La Lande, in 1772. This early French engraving of the Moon charts its geographical features using the system created by Giovanni Riccioli (1598-1671)

Background imageChart Collection: The Geographer, 17th century artwork

The Geographer, 17th century artwork by the Dutch painter Johannes Vermeer (1632-1675). This artwork was finished in 1669, and forms a pair with The Astronomer (V700/157), also by Vermeer


All Professionally Made to Order for Quick Shipping

"Unlocking the Secrets: Exploring the Fascinating World of Charts" Dive into the realm of reflexology with a detailed foot map chart, revealing hidden connections between pressure points and overall well-being. Immerse yourself in breathtaking artwork as "Kiss of the Oceans" captures the meeting point between Atlantic and Pacific through a mesmerizing chart inspired by the Panama Canal. Travel back in time with a captivating map showcasing the vast Ancient Persian Empire, unraveling its grandeur and historical significance. Follow in the footsteps of greatness as you trace King Alexander the Great's conquests on an intricate chart mapping his empire's expansion across continents. Join forces with The Salvation Army Campaign through their emblematic chart, highlighting their noble mission to bring hope and aid to those in need. Unveil Masonic mysteries through an enchanting chart that delves into both symbolic imagery and rich history surrounding Free and Accepted Masons. Embark on a journey through time with a remarkable Masonic chart, shedding light on ancient rituals, traditions, and brotherhood within this enigmatic society. Explore distant lands from centuries past as an Anglo-Saxon 10th-century world map unfolds before your eyes, offering insights into early cartography techniques. Discover rugged beauty amidst towering peaks with an old map of the Alps; let it guide you through nature's wonders while tracing historic routes taken by explorers long ago. Gain strategic insight during WWII using a military-focused map of Beirut, Lebanon; uncover hidden locations crucial for wartime operations throughout this historically significant cityscape. Step back in time to 1768 Edinburgh as James Craig's Map reveals New Town's first plan—a testament to meticulous topography shaping Scotland's capital cityscape over centuries. Test your vision acuity against an eye-catching eyesight test chart; decipher letters or symbols while appreciating the importance of visual health in our daily lives.