Fraud Blocker Skip to main content

Statistics Collection (page 3)

"Unveiling the Power of Numbers: Exploring the Fascinating World of Statistics" From the majestic "Kiss of the Oceans

Background imageStatistics Collection: Sir John Sinclair, Scottish politician and writer

Sir John Sinclair, Scottish politician and writer
Sir John Sinclair (1754-1835), 1st Baronet, Member of Parliament (1780-1811), and Scottish writer on finance and agriculture

Background imageStatistics Collection: Two pages of a postwar leaflet about Germany

Two pages of a postwar leaflet about Germany
Two pages (front and back cover) of a postwar reconstruction leaflet -- Germany under control, with a map showing the British Zone, and statistics. Date: circa 1947

Background imageStatistics Collection: Why Englands Food is Safe, WW1

Why Englands Food is Safe, WW1
Why Englands Food is Safe, showing how the majority of food supplies come from countries who are not on the side of the enemy during the First World War. Date: 1914

Background imageStatistics Collection: Silhouettes, personnel involved in the Great War

Silhouettes, personnel involved in the Great War
Silhouettes showing the numbers of soldiers and sailors of Russia, Germany, France, Austria, Britain and Holland involved in the First World War. Date: 1914

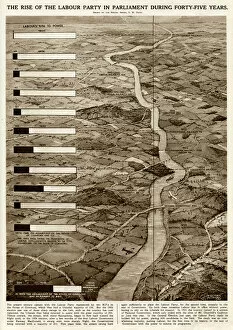
Background imageStatistics Collection: Rise of the Labour Party in Britain by G. H. Davis

Rise of the Labour Party in Britain by G. H. Davis
The rise of the Labour Party in the British Parliament over the course of 45 years, symbolised as a river growing wider and wider

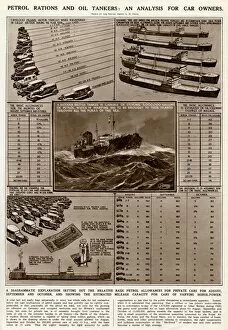
Background imageStatistics Collection: Petrol rations and oil tankers by G. H. Davis

Petrol rations and oil tankers by G. H. Davis
Petrol rations and oil tankers: an analysis for car owners during the Second World War. A diagrammatic explanation setting out the relative basic petrol allowances for private cars for August

Background imageStatistics Collection: Germanys desperate oil situation by G. H. Davis

Germanys desperate oil situation by G. H. Davis
The merciless statistics of Germanys desperate oil situation during the Second World War. The relative value of Germanys normal sources of oil supply, cut in half by the Allied blockade

Background imageStatistics Collection: Sir Robert Stopford

Sir Robert Stopford
SIR ROBERT STOPFORD naval commander; for no obvious reason, his portrait is circumscribed with statistics relating to the population of the Empire. Date: 1768 - 1847

Background imageStatistics Collection: Pie chart illustration representing grassland, forest, farmland and built-up areas of Portugal

Pie chart illustration representing grassland, forest, farmland and built-up areas of Portugal

Background imageStatistics Collection: Pie chart iIllustration of percentage of population in urban and rural areas

Pie chart iIllustration of percentage of population in urban and rural areas, example of Portugal with a majority of rural population

Background imageStatistics Collection: Pie chart illustration representing farmland, forest, mountain, and built-up areas of Germany

Pie chart illustration representing farmland, forest, mountain, and built-up areas of Germany

Background imageStatistics Collection: Population chart represented by outlines of people

Population chart represented by outlines of people

Background imageStatistics Collection: At the Great Labour Demonstration in Hyde Park: John Burns Gives some Statistics

At the Great Labour Demonstration in Hyde Park: John Burns Gives some Statistics, London, Uk

Background imageStatistics Collection: Map of Europe, 1841 (colour litho)

Map of Europe, 1841 (colour litho)
XCF306031 Map of Europe, 1841 (colour litho) by German School, (19th century); Private Collection; German, out of copyright

Background imageStatistics Collection: Outline of the Topography and Statistics of the Southern Districts of Oud h

Outline of the Topography and Statistics of the Southern Districts of Oud h, and of the cantonment of Sultanpur-Oud h, maps, 19th century engraving

Background imageStatistics Collection: Map valley of the Ganges India, Outline of the Topography and Statistics of the Southern

Map valley of the Ganges India, Outline of the Topography and Statistics of the Southern Districts of Oud h, and of the cantonment of Sultanpur-Oud h, 19th century engraving

Background imageStatistics Collection: The Forthcoming Meeting of the British Association, 1883, the President-Elect And

The Forthcoming Meeting of the British Association, 1883, the President-Elect And
THE FORTHCOMING MEETING OF THE BRITISH ASSOCIATION, 1883, THE PRESIDENT-ELECT AND PRESIDENTS OF DEPARTMENTS: R.H. Inglis Palgrave, Esq. (Economic Science and Statistics), Lieut.-Col. H.H

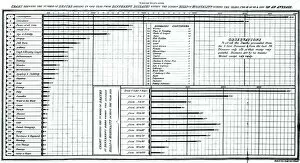
Background imageStatistics Collection: Chart from London Bills of Mortality

Chart from London Bills of Mortality
Chart compiled from London Bills of Mortality for 1796 - 1800, showing the number of deaths from various causes and the number of deaths at different ages

Background imageStatistics Collection: Disease statistics F008 / 2930

Disease statistics F008 / 2930
Disease statistics

Background imageStatistics Collection: Measuring Instruments and Techniques. C017 / 3475

Measuring Instruments and Techniques. C017 / 3475
Plate from 18th century encyclopedia showing illustrations of various measuring instruments and techniques. Dendrometry is the branch of botany that is concerned with the measurement of the various

Background imageStatistics Collection: Joseph-Francois Malgaigne

Joseph-Francois Malgaigne (1806-1865) was a distinguished French surgeon, medical historian and anatomist. He specialised in fractures and the orthopaedic surgery of the knee, hip and shoulder

Background imageStatistics Collection: Information leaflet, rockets, WW2

Information leaflet, rockets, WW2
Information leaflet published in 1946, summarising statistics on rockets (V2) which fell during the latter stages of the Second World War, with the number of people killed and injured

Background imageStatistics Collection: Information leaflet, flying bombs, WW2

Information leaflet, flying bombs, WW2
Information leaflet published in 1946, summarising statistics on flying bombs (V1) which fell during the latter stages of the Second World War, with the number of people killed and injured

Background imageStatistics Collection: Random universe

Random universe. Conceptual computer artwork of dice in space. This represents the fundamental uncertainty of the universe

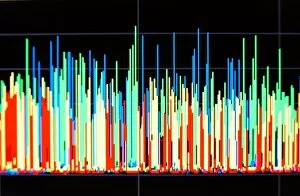
Background imageStatistics Collection: Histogram

Histogram. Screen displaying a histogram. A histogram is a types of graph that displays frequencies

Background imageStatistics Collection: Silhouetted statisticians with a computer 3D graph

Silhouetted statisticians with a computer 3D graph
Graph. Two silhouetted statisticians looking at data displayed as a 3-dimensional (3-D) graph on a computer screen

Background imageStatistics Collection: Pierre Louis, French physician

Pierre Louis, French physician

Background imageStatistics Collection: Graph paper, abstract artwork

Graph paper, abstract artwork
Graph paper, abstract computer artwork of graph paper flying through the air

Background imageStatistics Collection: Greek letter Omega, lower case

Greek letter Omega, lower case
Omega is the 24th and last letter of the Greek alphabet. In the Greek numeric system, it has a value of 800. The letter omega is used as a symbol in chemistry, physics, statistics, and mathematics

Background imageStatistics Collection: Greek letter Nu, lower case

Greek letter Nu, lower case
Lions mane jellyfish (Cyanea capillata). Lions mane jellyfish are the largest known species of jellyfish. They can reach over 2 metres across with tentacles of around 30 metres long

Background imageStatistics Collection: Carbon dioxide levels, Atlantic, 2003

Carbon dioxide levels, Atlantic, 2003
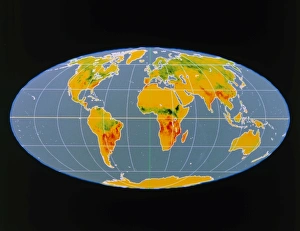
Atmospheric carbon dioxide levels centred on the Atlantic Ocean, satellite data. Carbon dioxide (CO2) is a greenhouse gas that contributes to global warming

Background imageStatistics Collection: Breathing Earth CO2 input / output, global map

Breathing Earth CO2 input / output, global map
Breathing Earth CO2 input/output, global map

Background imageStatistics Collection: Global methane concentration, 2004

Global methane concentration, 2004
Global methane concentration. Map showing the concentration of methane (CH4) gas in the stratosphere (about 10-50 kilometres in altitude) on 25th July 2004

Background imageStatistics Collection: Achilles and Ajax

Achilles and Ajax
Amphora dating from 540-530 BC, signed by the potter and painter Exekias, it shows Achilles and Ajax playing a game using dice during a lull in the Trojan War

Background imageStatistics Collection: Native American census roll, artwork

Native American census roll, artwork
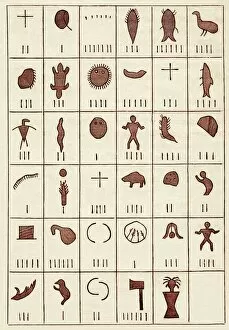
Native American census roll. Artwork of a census roll of an Indian band at Mille Lac, Minnesota, USA. This census was compiled in 1849 by Nago-nabe, a Chipeway Indian

Background imageStatistics Collection: Production and Plunder, campaigning statistics

Production and Plunder, campaigning statistics
A slide entitled Production & Plunder, used for a lecture about the South Wales Miners Federation. Statistics are listed, comparing the royalties on the use of coal on the luxury steamer
Background imageStatistics Collection: Census tabulation in former Lambeth workhouse

Census tabulation in former Lambeth workhouse
Data from the 1931 census being transferred to punched cards in the former Lambeth workhouse - presumably the one on Princes Road (now Black Prince Road), Lambeth, south London

Background imageStatistics Collection: The Statistics Board at Frankfurt Airport during the Berlin

The Statistics Board at Frankfurt Airport during the Berlin
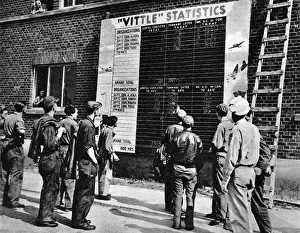
Photograph showing American aircrew studying the achievement board at Frankfurt-on-Main showing the daily and overall tonnage of supplies flown from Frankfurt to Berlin, during the airlift of 1948

Background imageStatistics Collection: Voter Turnout 1978

Voter Turnout 1978
At the Conservative Party headquarters, the voter turnout is being examined


All Professionally Made to Order for Quick Shipping

"Unveiling the Power of Numbers: Exploring the Fascinating World of Statistics" From the majestic "Kiss of the Oceans, " where Atlantic meets Pacific through the remarkable engineering feat of the Panama Canal, to historical artifacts like the "Daily Mail War Map" during WW1 and a British Empire world map from the 19th century, they have played an essential role in shaping our understanding of complex phenomena. In this captivating journey, we encounter influential figures such as John Venn, whose iconic caricature C013/7595 represents his groundbreaking work on probability and logic. We also delve into Gregor Mendel's pioneering research as an Austrian botanist, unraveling genetic inheritance patterns that laid the foundation for modern genetics. Even within sports history, they have left their mark. The lithograph by Currier and Ives depicting American heavyweight pugilist John L. Sullivan showcases how statistical analysis can capture athletic achievements and contribute to sporting legacies. Beyond individual accomplishments, statistics provide insights into societal progress. Colored engravings showcasing agricultural and manufacturing output alongside wealth and debts in the United States highlight how data has been used to assess economic growth or challenges throughout history. Moreover, G. H. Davis's exploration of factors governing invasions reminds us that statistical analysis extends beyond numbers alone; it encompasses strategic decision-making processes with real-world implications. Examining social issues is another realm where statistics prove invaluable. A glimpse at St Lukes Parish's statement on poor relief in 1854 demonstrates how data-driven approaches were employed to address poverty-related concerns even centuries ago. Fast forward to Bournville Village – a testament to George Cadbury's vision – where meticulously collected statistics shed light on its development as a model village promoting social welfare alongside industrial success in early 20th-century Britain. However, not all statistical findings are positive; they sometimes reveal alarming trends requiring attention.