
Infographic Collection
Unlocking the Power of Visual Data: Explore a world of knowledge with these captivating infographics


All Professionally Made to Order for Quick Shipping
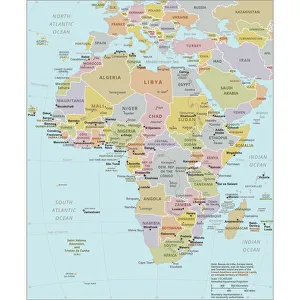
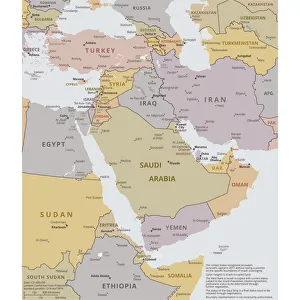
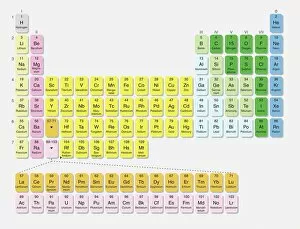
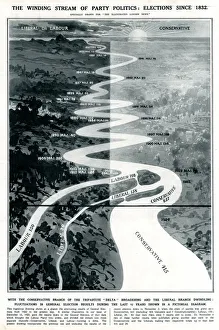
Unlocking the Power of Visual Data: Explore a world of knowledge with these captivating infographics. From political maps showcasing Africa and the Middle East to an interactive periodic table, these illustrations bring information to life. Witness the intricate web of air traffic or navigate through the vast blogosphere with an internet blog map. Delve into human anatomy with a detailed engraving of a labelled skeleton or discover America's diverse regions on a general reference map. Trace the winding stream of politics through historic elections since 1832, while exploring North America's geography. Marvel at a vintage medical illustration depicting facial nerves or follow the figurative and approximate movement of travelers on railways worldwide. Lastly, journey back in time to NASA's proposed mission from 1961. These they are windows into our world, offering insights that transcend time and space.