
Electrocardiograph Collection
"Capturing the Rhythm of Life: Exploring the Electrocardiograph" Step into the world of electrocardiography


All Professionally Made to Order for Quick Shipping
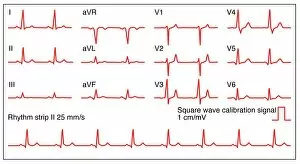
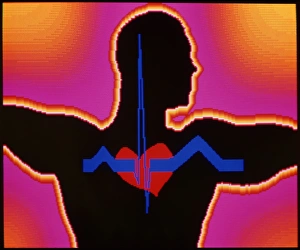
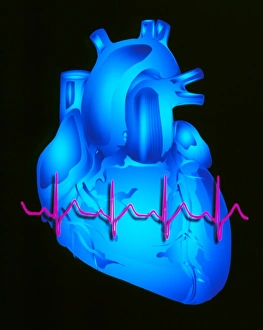
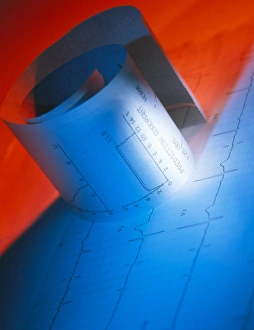
"Capturing the Rhythm of Life: Exploring the Electrocardiograph" Step into the world of electrocardiography, where science and art intertwine to reveal the secrets of our beating hearts. With ECGs showcasing a normal heart rate, this captivating technology unveils intricate patterns that reflect our inner vitality. Intriguingly, an early glimpse into this realm can be found in Cambridge's historic electrocardiograph from 1911. This pioneering device paved the way for modern ECG monitors, which now provide us with real-time insights into our cardiac health. Imagine witnessing red blood cells coursing through your veins as they synchronize harmoniously with each heartbeat. Such imagery comes alive through conceptual artwork like F006/3776, reminding us of the profound connection between these vital components. A close-up view of an ECG monitor with printout emerging offers a tangible representation of our heart's electrical activity. It serves as a reminder that every beat is meticulously recorded and analyzed by medical professionals to ensure optimal cardiovascular well-being. Conceptual artworks such as C018/8585 depict mesmerizing heartbeat traces, capturing both their elegance and significance. These visual representations serve not only as aesthetic marvels but also evoke contemplation about the fragility and resilience inherent within each individual's cardiac rhythm. Artwork C018/8588 takes on a different tone by portraying a heartbeat alert – an urgent call for attention to potential irregularities or imbalances within one's cardiovascular system. This striking image reminds us to prioritize heart health and seek timely medical intervention when necessary. Continuing on this artistic journey, C018/8586 and C018/8587 present additional variations in heartbeat traces; their unique patterns symbolize diversity among individuals' cardiac rhythms while highlighting how intricately interconnected we all are at our core. Delving deeper into cardiology's vast domain, conceptual image C017/7718 encapsulates its essence.